Introduction
Microsoft Report builder is a easy tool to build dashboard and graphical reports with less effort which is provided by Microsoft. This article will describe simple steps to build report using Microsoft report builder tool. In this part, the article will explain concept of report generation with an example starting from beginning steps: how to connect with data source or database from MS report builder, steps to create datasets, and build SSRS Reports using SQL Server database. Additionally, it will elucidate how to write simple expression in reports and represent report data in tabular form. Learners will be able to build reports including expression and representation of data in table form from the scratch.
Follow the below steps to build your report using Microsoft Report Builder
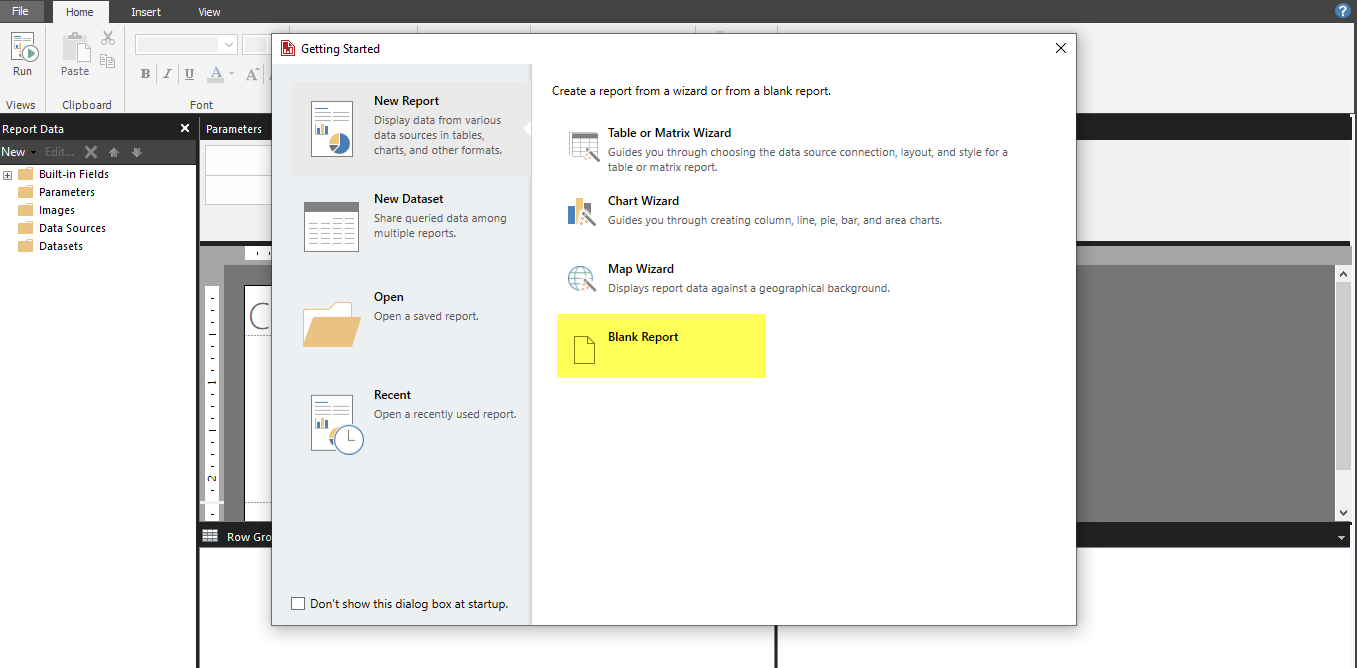
- Open Report Builder. Below screen will be popup.
Then select Blank Report. However, you can opt to Table or Matrix Wizard, Chart Wizard and Map Wizard from Report builder.
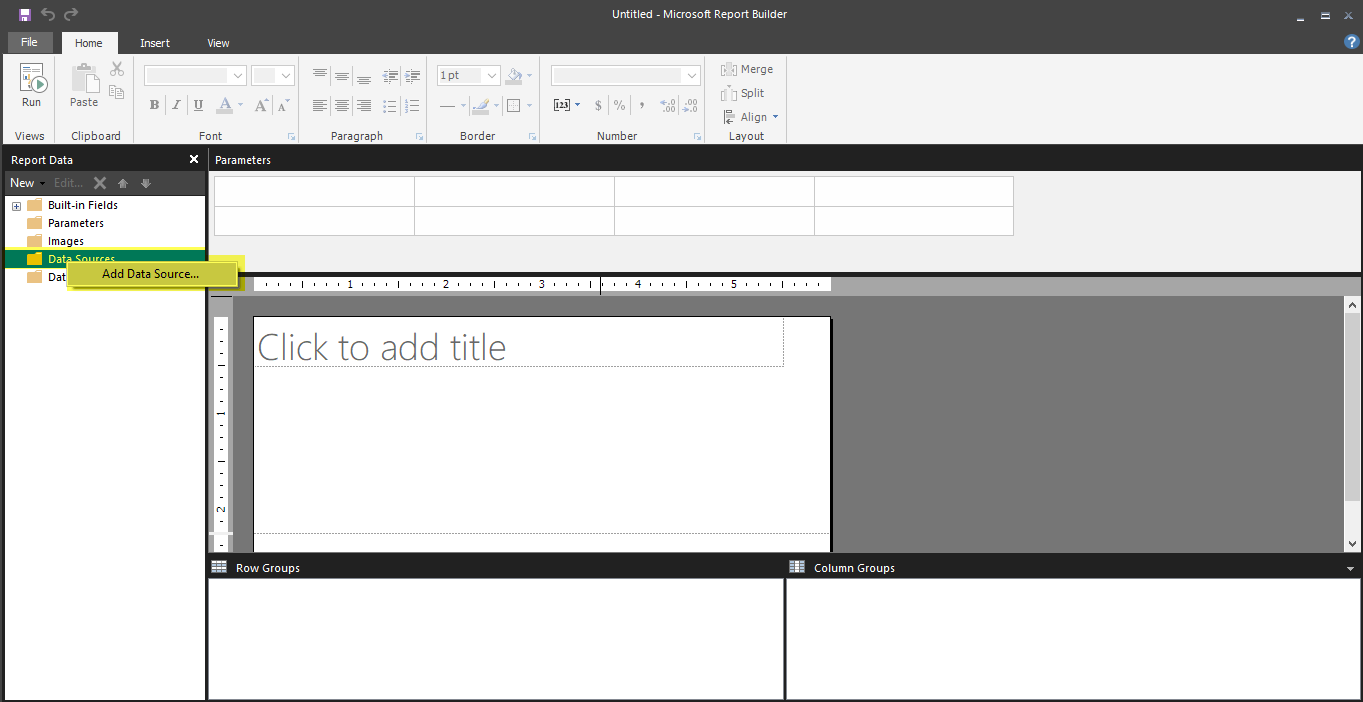
2. Click on Add Data Sources and then Add data Source.
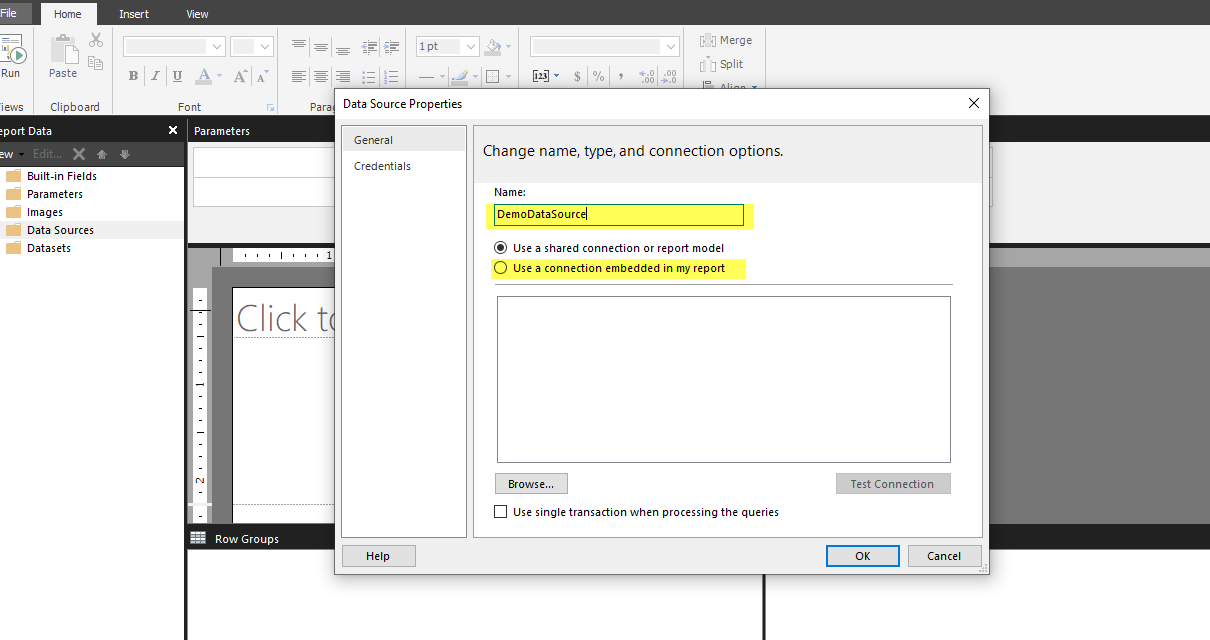
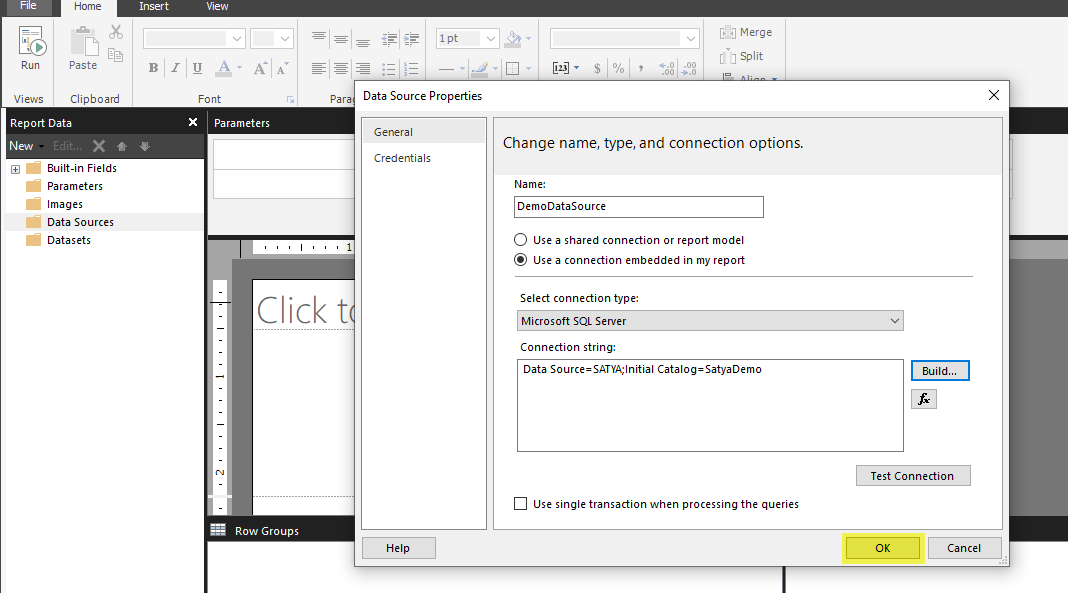
3. Give Name of your Data source and select Use a connection embedded in my report. However, if you want to use shared connection or report model you can select that also.
4. Select Connection Type: You can select connection Type as depicted in below image. In my case, database is in MS SQL Server, So I have selected Microsoft SQL Server.
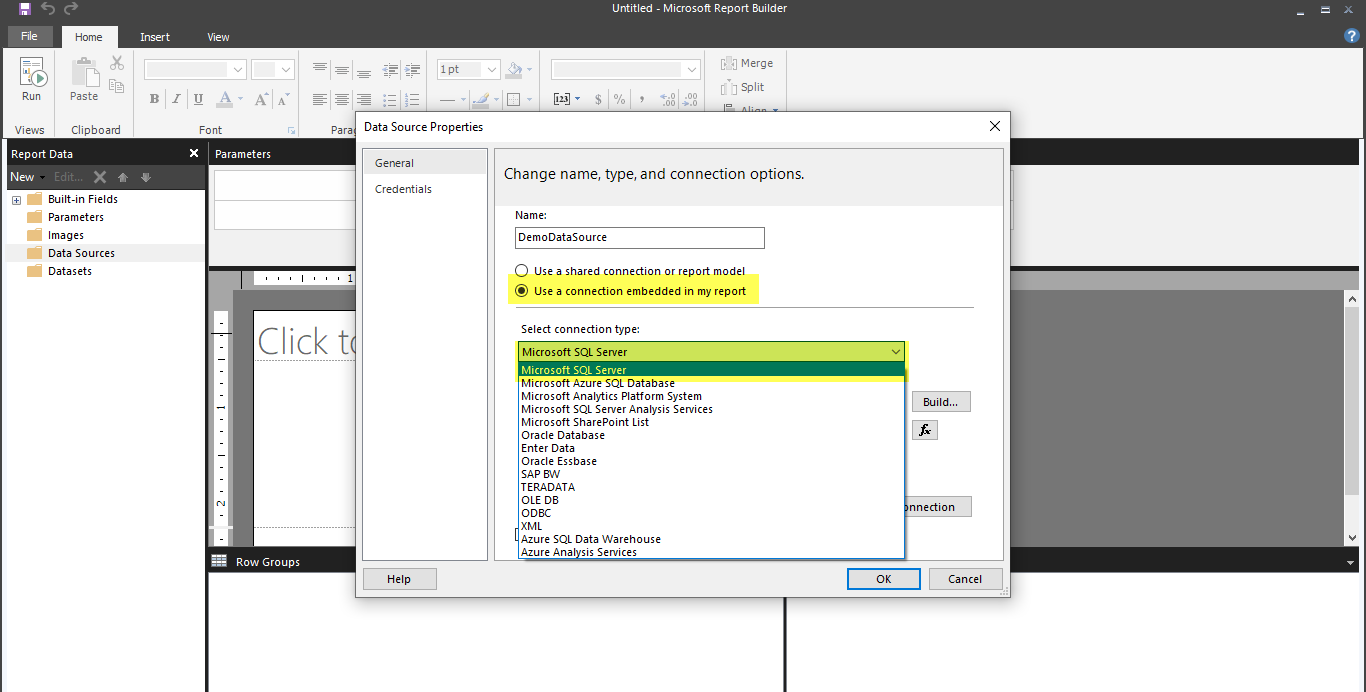
Then click on Build

5. Provide Server Name, Authentication: User Id, Password, select Database and then click Test Connection.

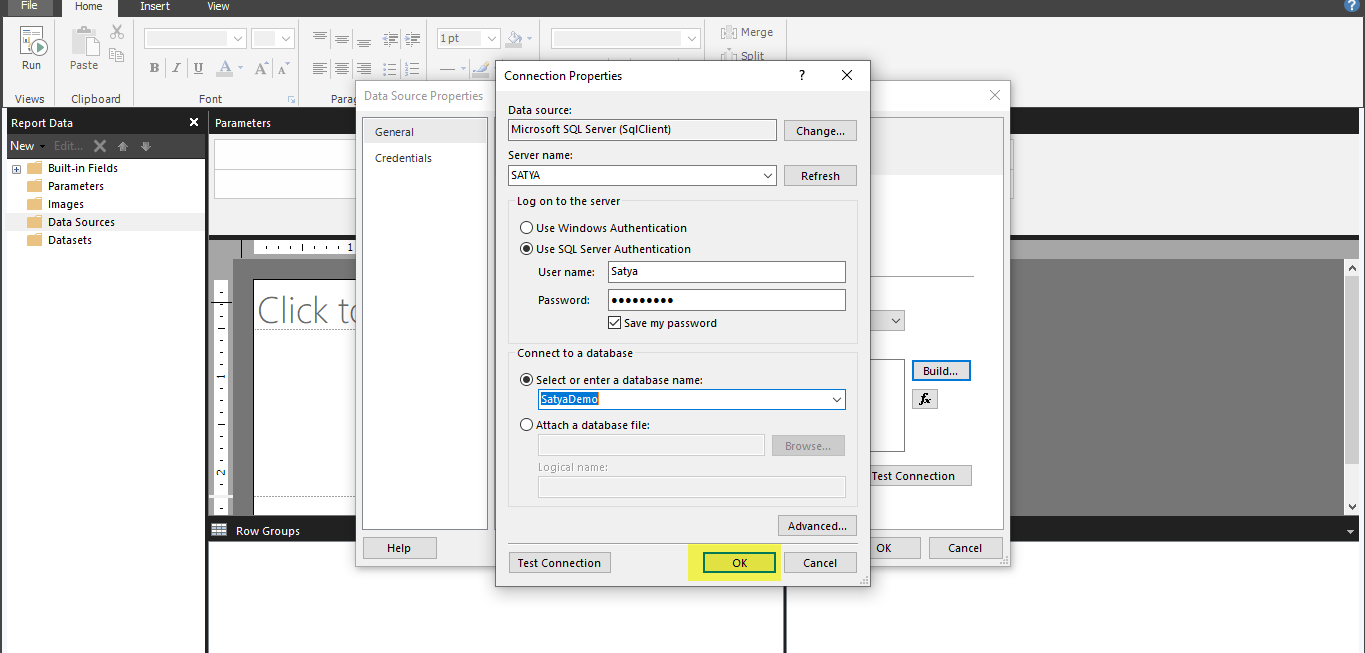
Clicking on OK will popup the success message box.
6. Subsequently, Click on Ok of below screen
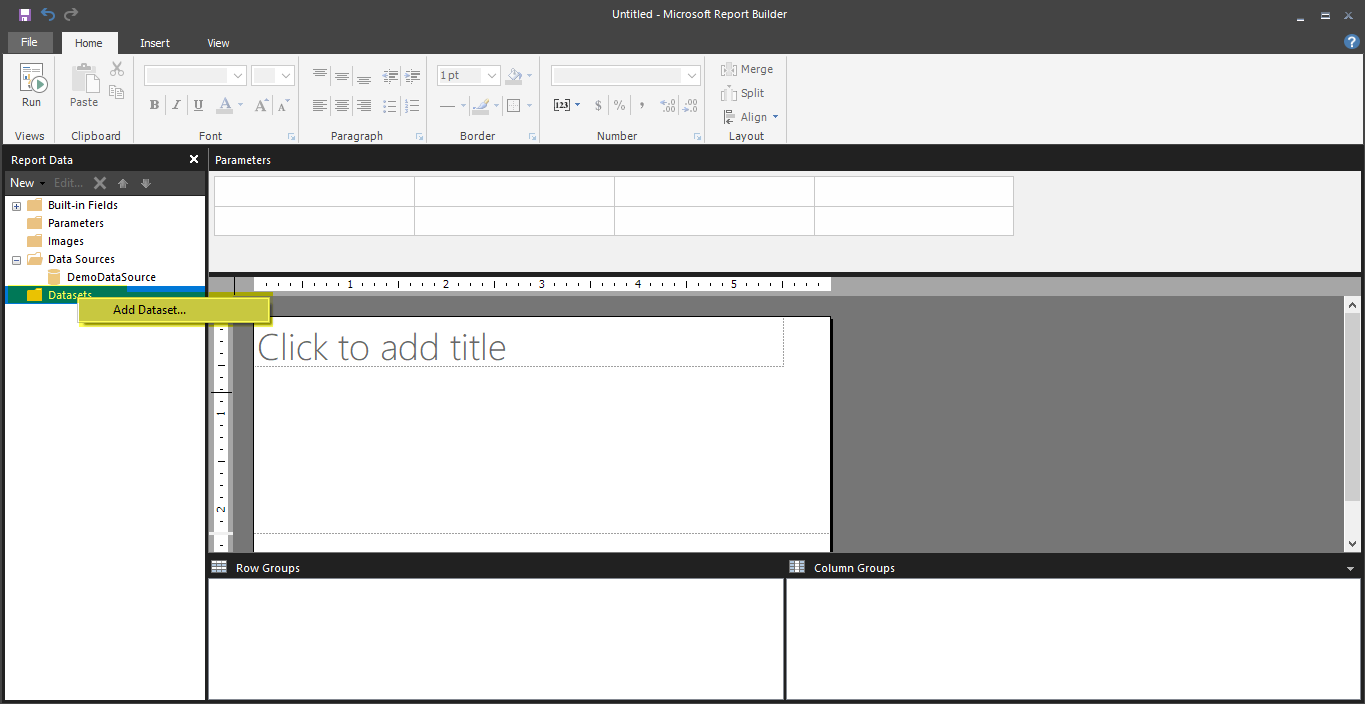
7. Next Step is to add Dataset. For this, Click on Add Datasets
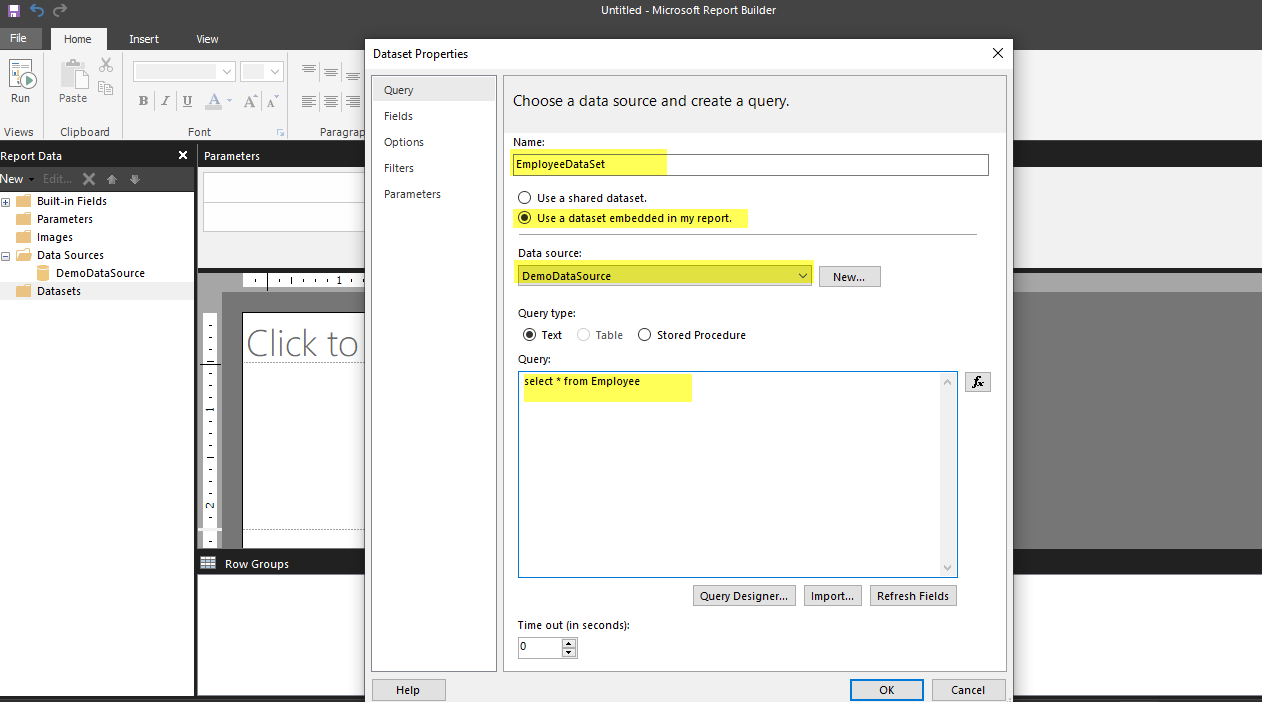
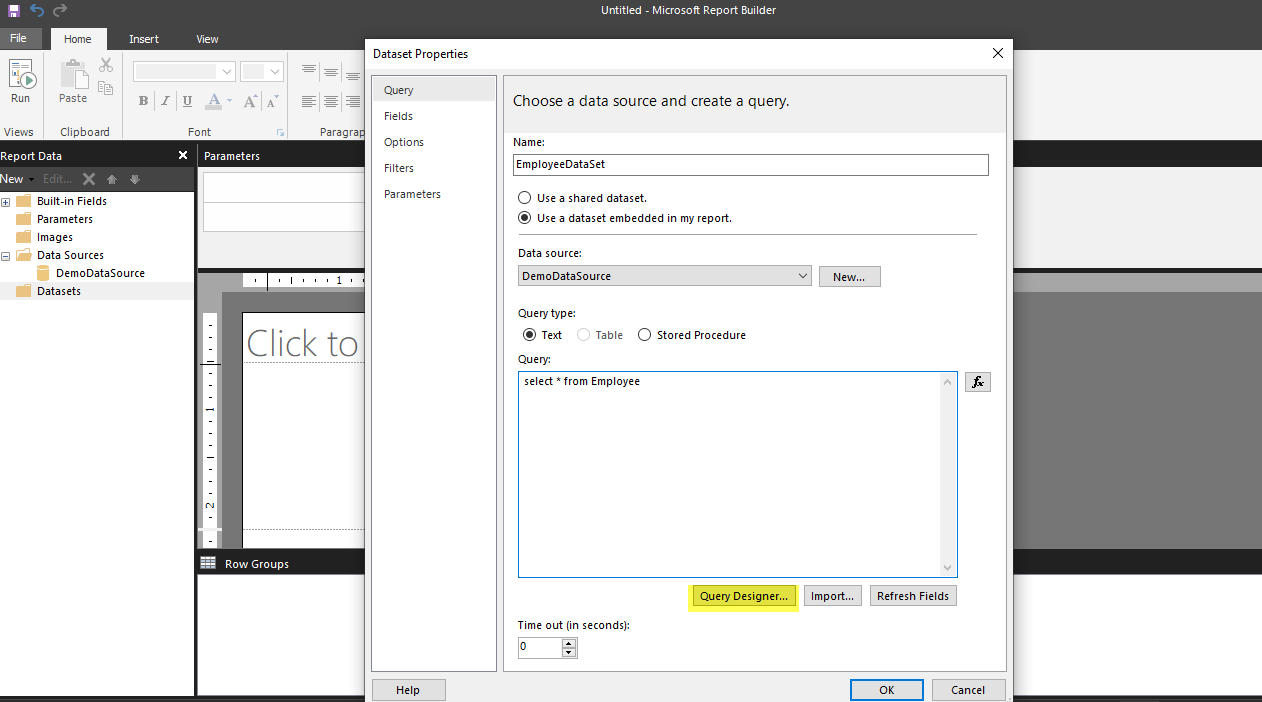
8. Insert Dataset Name, select Data source, write query to get data from your database. For demo purpose, I am going to use Employee Table from my database.
9. Then click on Query Designer as depicted below
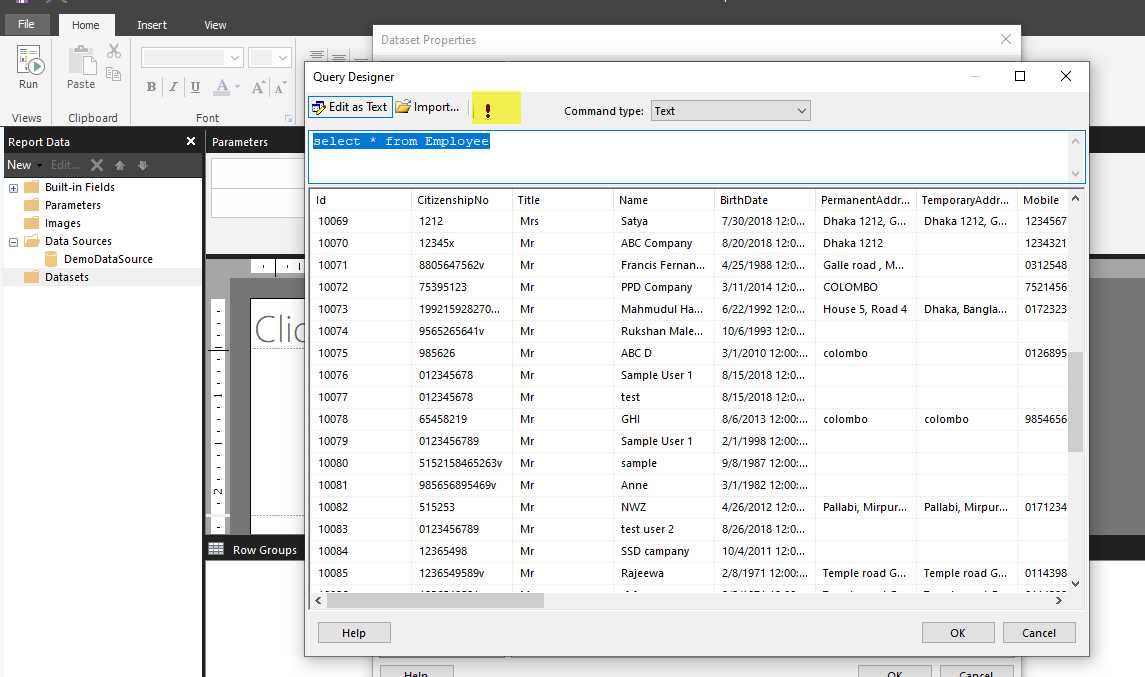
10. Click on Run Command, it runs the command and gets all the selected values in the list. After that click on OK.
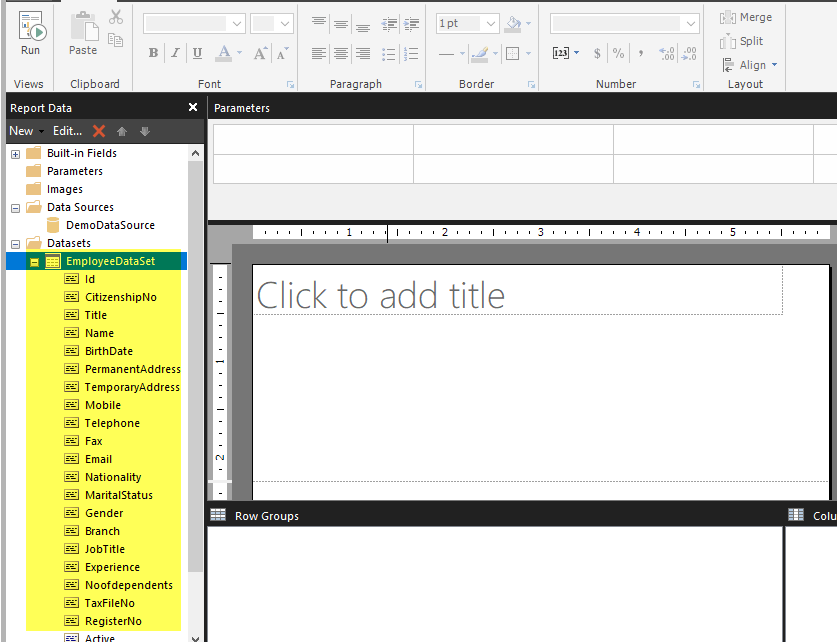
11. Now your dataset is ready to use. All the selected columns will be listed in the your dataset
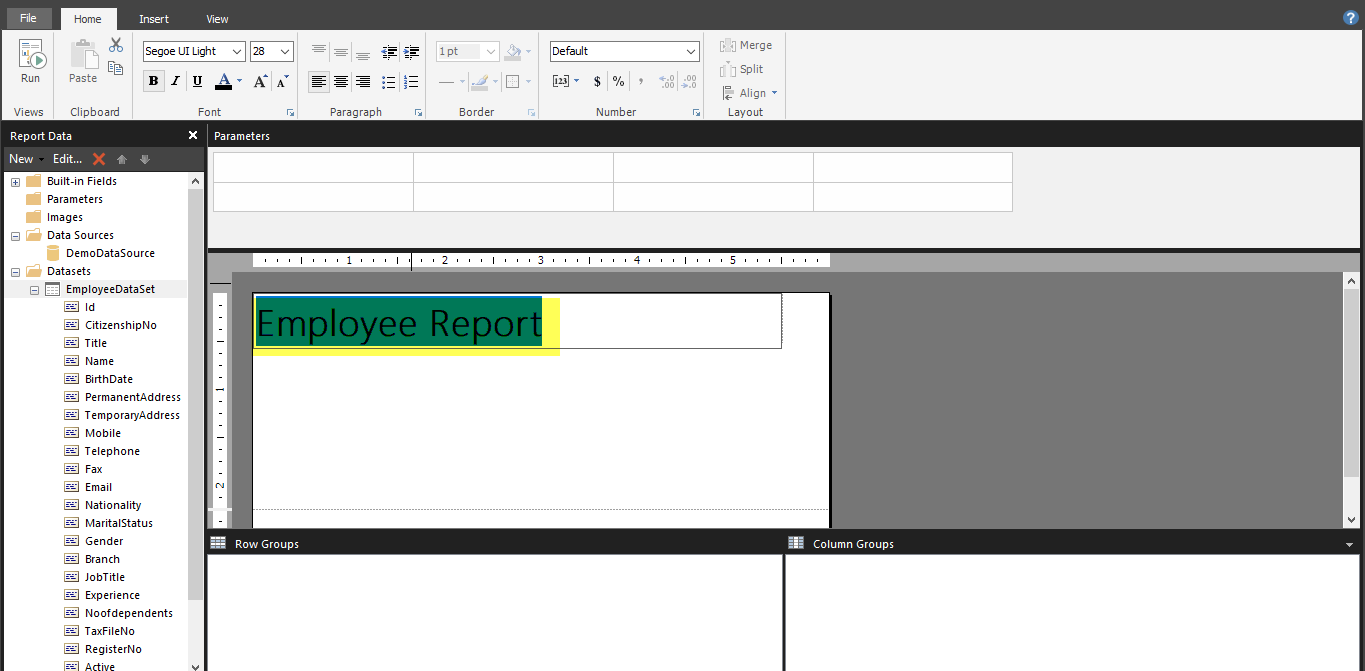
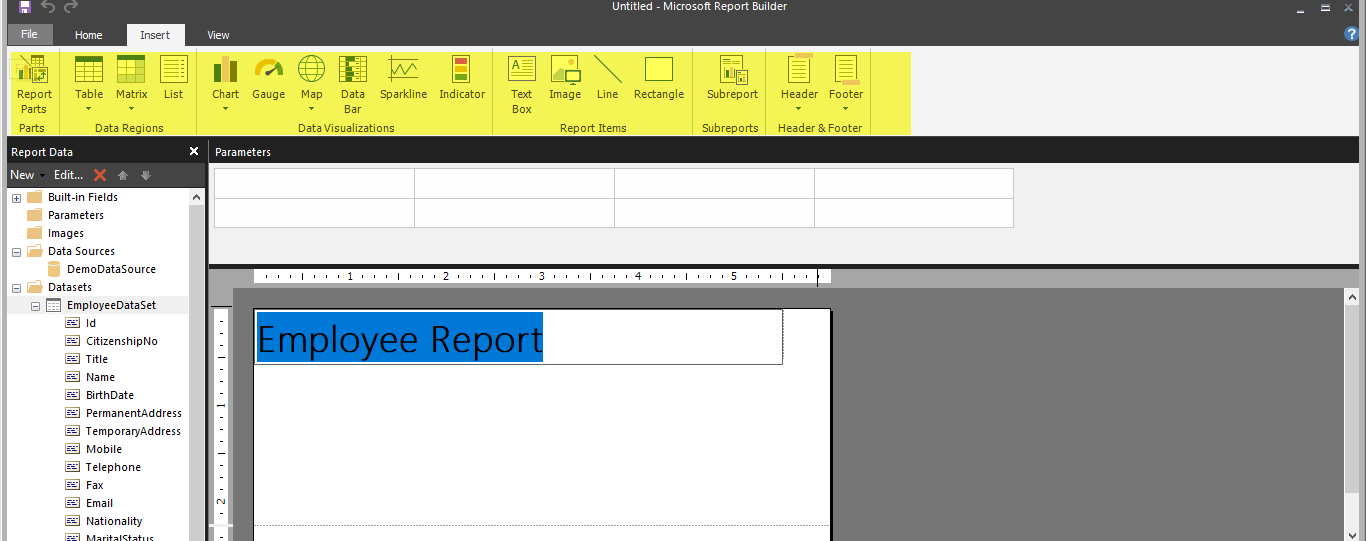
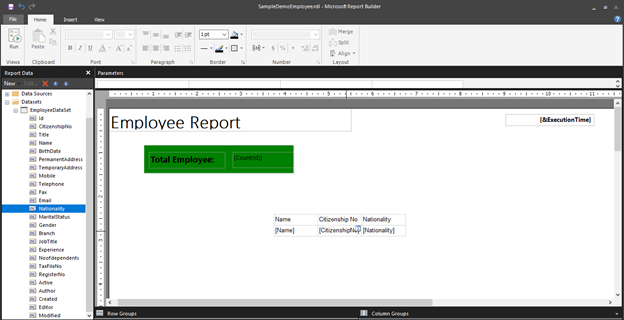
12. Now it’s time to design the report. firstly, give title of your report. Click on Click to add title area and give your report name. For my case, I am giving Employee Report as Title of of report.
MS Report Builder: If you go to Insert option then, you can see a lot of options to design reports. MS Report builder provides varieties of drag and drop options to design interactive graphical reports with less effort.
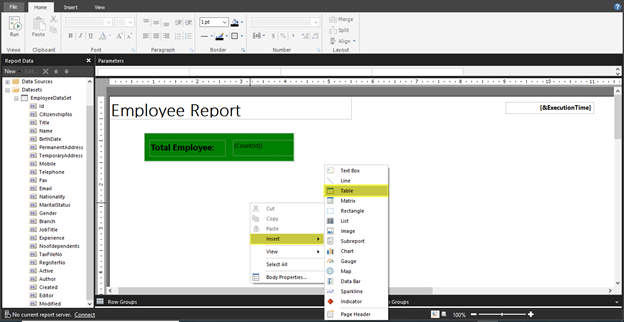
If you right click on body and go to insert option from there also you can get option to format your report as well as insert graphical tools such as table, chart, line text, header, footer etc for report.

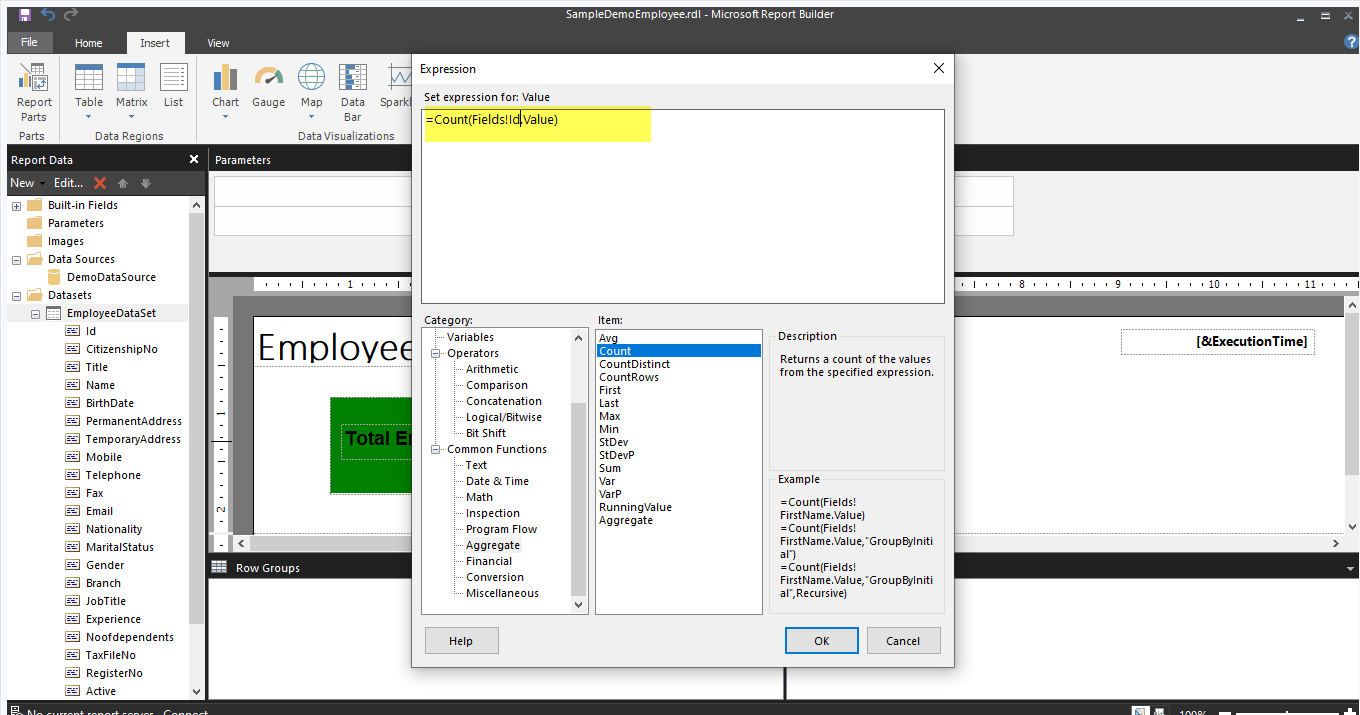
To Show total number of Employee: Select the Rectangle, fill the color of rectangle as per your choice, insert Text Box inside it and insert another text box for Expression to get total no of count. The purpose of using two text box is: one to show Label and another to show total no of count using expression.
Right click on empty textbox as shown below and click on expression

To Get total no of count write following expression:
=Count(Fields!Id.Value)
Or
=Count(Fields!Id.Value,”YourDatasetName”)
If you have two or more dataset then it is necessary to provide dataset name. I have single dataset so I don’t need to provided dataset name in my expression.
Report Data in Table: Right click on body, go to insert, and click on table.
Select the column that you want to show in table and drag it and drop inside the table column as illustrated below.
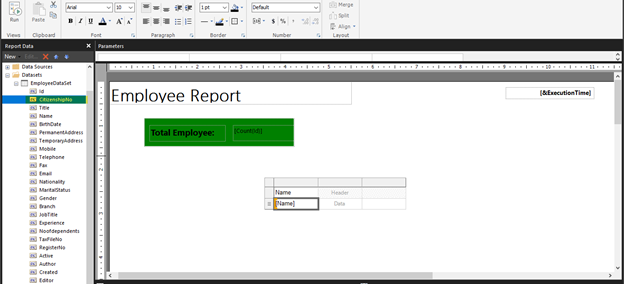
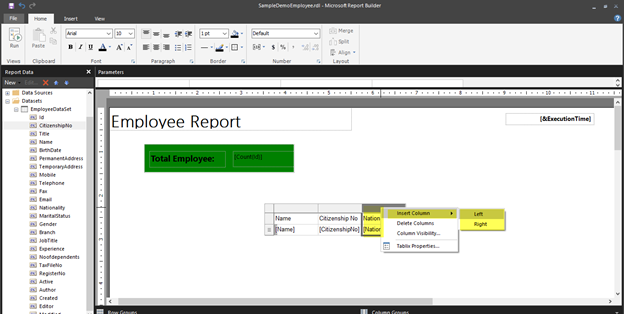
To add more column in table, select the column -> right click and go to insert column and then choose where you want to add on the right side of selected column or left side.
In my tabular report, I have selected Name, Citizenship No, Nationality, Marital Status, Gender, Branch and Telephone No in the table and during the run my tabular report looks like as depicted below.
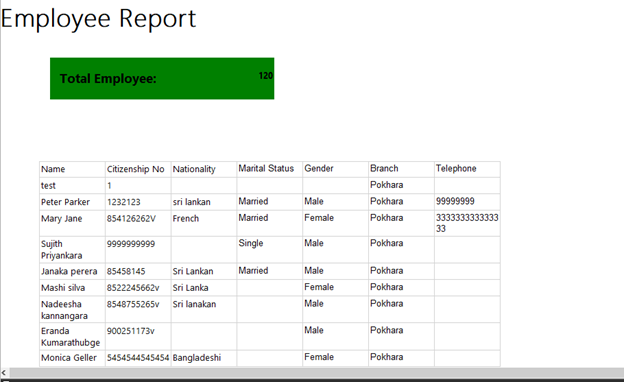
Table Design Format: We can format the design of table according to our wish. To change the foreground colour of heading: select first row of table and go to fill option and choose colour of your choice. Furthermore, we can change style of font from the available options. Besides this, we can drag and stretch the size of column as well as drag and move the whole table and relocate it according to our need.

Conclusion
Hence, this article described the simple steps to a build the report using Microsoft Report Builder using SQL Server database. The article demonstrated steps to define data source or connect database from MS report builder, create datasets and build SSRS Reports using SQL Server database which would be helpful for beginners. As well as learner will be able to write/understand basic knowledge of expressions and show the report data in tabular format in the report. In the next part, I will explore and demonstrate more about bar graph and pie chat design for dashboard and graphical reports.
Great article for beginners!!!
Thank you!!
[…] SSRS Part1: https://satyakarki.home.blog/2020/07/18/build-report-from-microsoft-report-builder-part-1/ […]
[…] SSRS Part1 […]
Best view i have ever seen !